Your address will show here +12 34 56 78
2023 Blog, Research Gateway, Blog, Command blog, Feature Blog, Featured

Secure Research Environments provide researchers with timely and secure access to sensitive research data, computation systems, and common analytics tools for speeding up Scientific Research in the cloud. Researchers are given access to approved data, enabling them to collaborate, analyze data, share results within proper controls and audit trails. Research Gateway provides this secure data platform with the analytical and orchestration tools to support researchers in conducting their work. Their results can then be exported safely, with proper workflows for submission reviews and approvals.

The Secure Research Environments build on the original concept of Trusted Research Environment defined by UK NHS and uses the five safes framework for safe use of secure data. The five elements of the framework are:

  • Safe people
  • Safe projects
  • Safe settings
  • Safe data
  • Safe outputs

There are the following key building blocks for the solution:

  • Data Ingress/Egress
  • Researcher Workflows & Collaborations with costs controls
  • On-going Researcher Tools Updates
  • Software Patching & Security Upgrades
  • Healthcare (or other sensitive) Data Compliances
  • Security Monitoring, Audit Trail, Budget Controls, User Access & Management

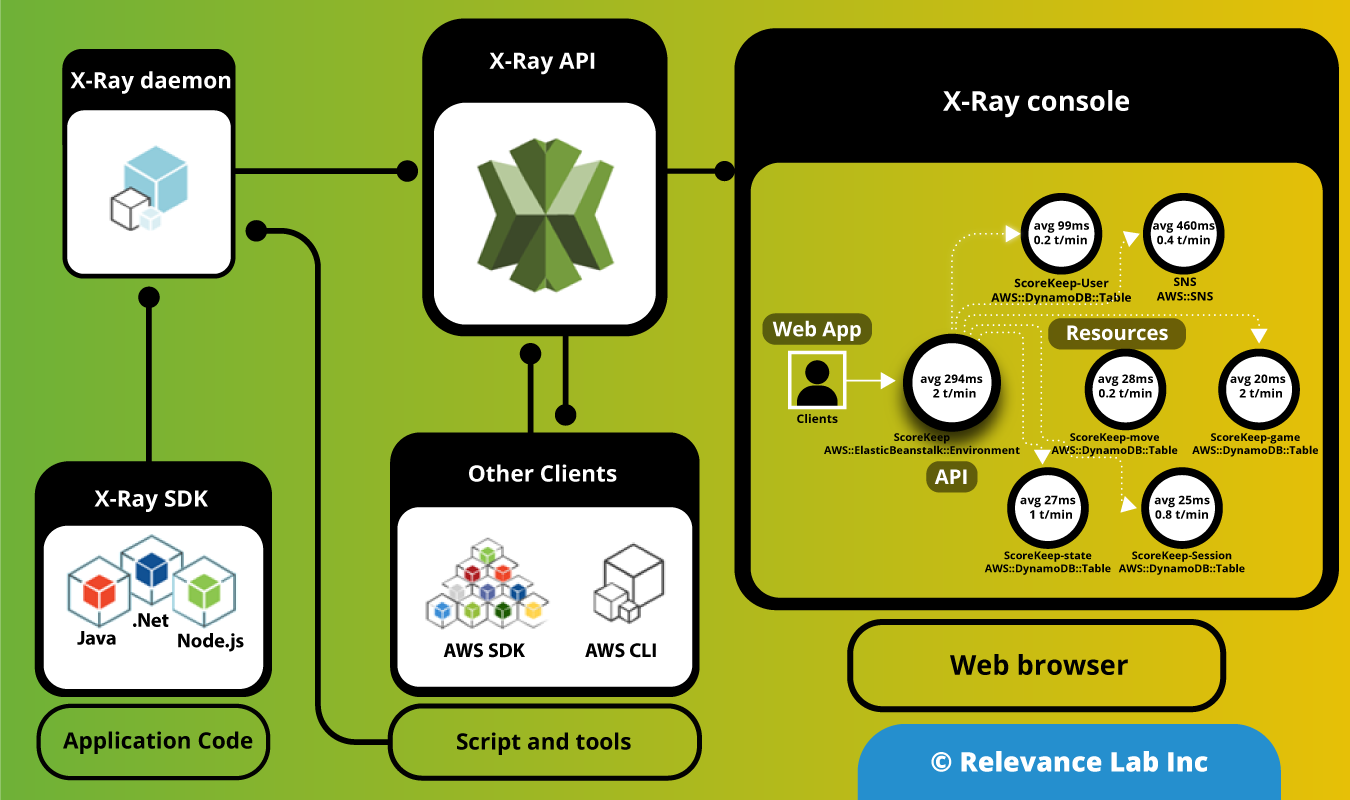
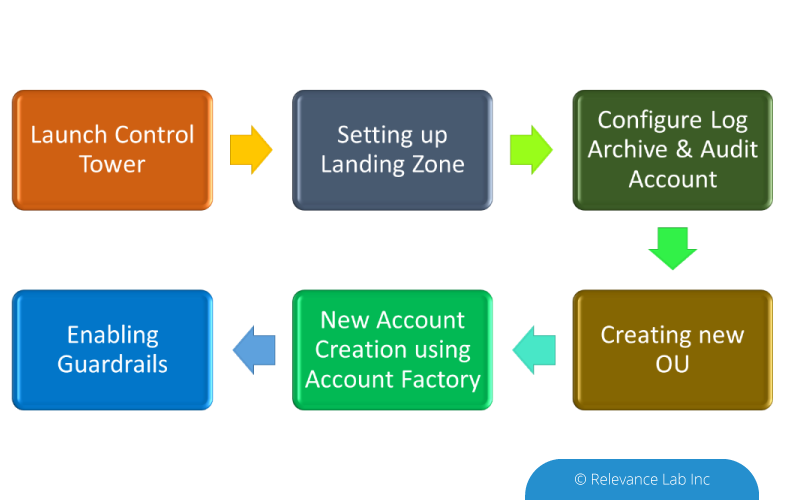
The figure below shows implementation of Secure Research Environments solution with Research Gateway.


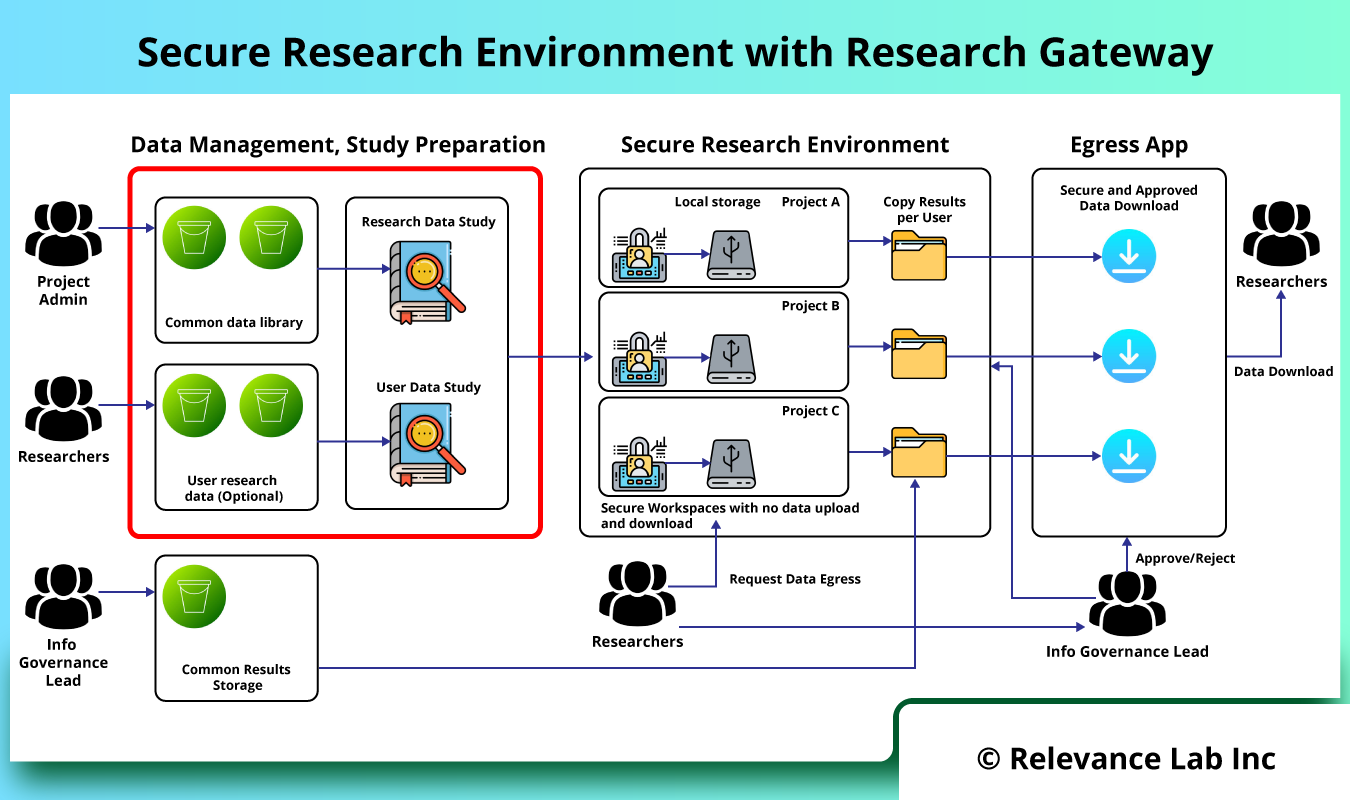
The basic concept is to design a secure data enclave in which there is no ability to transfer data into or out of without going through pre-defined workflows. Within the enclave itself any amount or type of storage/compute/tools can be provisioned to fit the researcher’s needs. There is capability to use common research data and also bring in specific data by researchers.

The core functionality for Secure Research Environments deal with solutions for the following:
Data Management and Preparation
This deals with “data ingress management” from both public and private sources for research. There are functionalities dealing with data ingestion, extraction, processing, cleansing, and data catalogs.

Study Preparation
Depending on the type of study and participants from different institutions, secure data enclave allows for study specific data preparation, allocation, access management and assignment to specific projects.

Secure Research Environment
A controlled cloud environment is provided for researchers to access the study data in a secure manner with no direct ingress-egress capability and conduct research using common tools like JupyterLab, RStudio, VSCode etc. for both interactive and batch processing. The shared study data is pre-mounted on research workspaces making it easy for researchers to focus on analysis without getting into complexity of infrastructure, tools and costs.

Secure Egress Approvals for Results Sharing
Post research if researchers want to extract results from the secure research environment, a specialized workflow is provided for request, review, approvals, and download of data with compliance and audit trails.

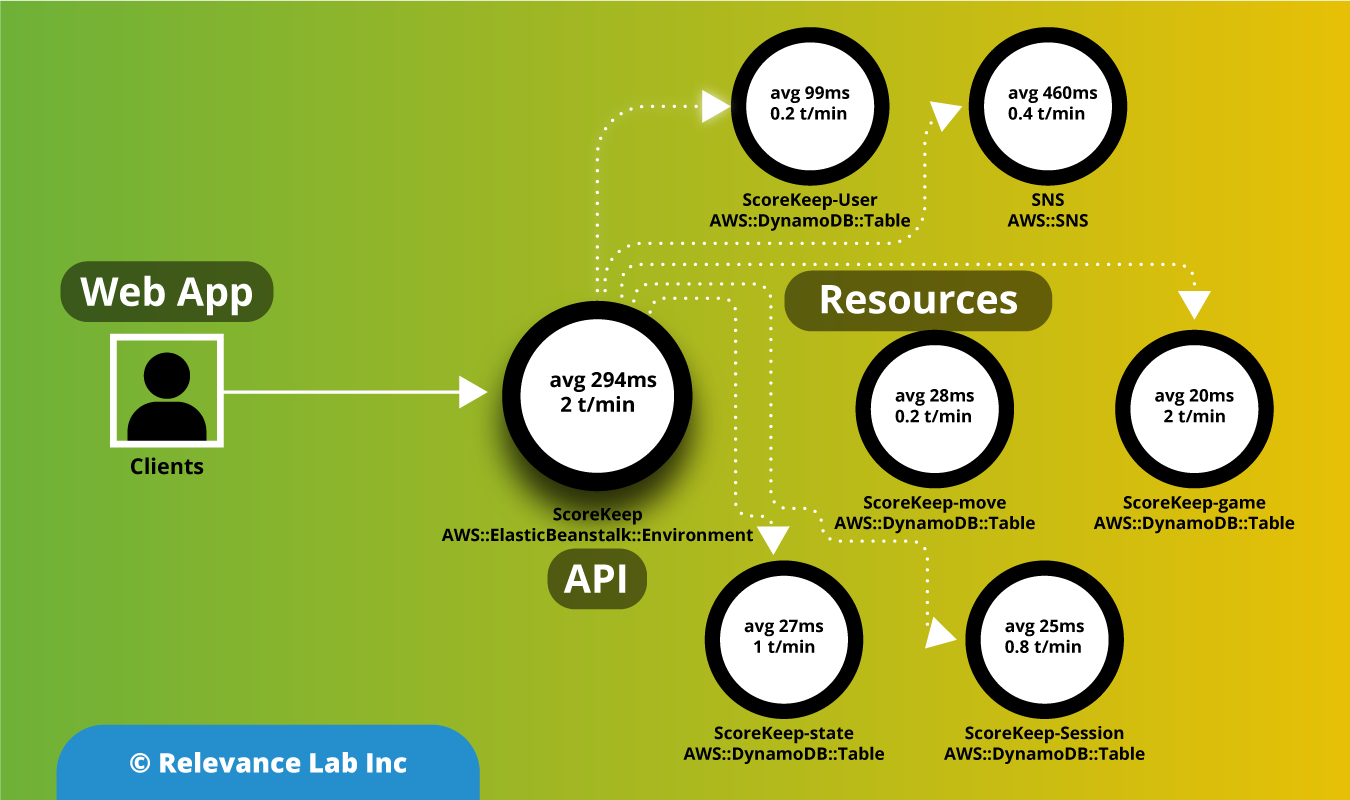
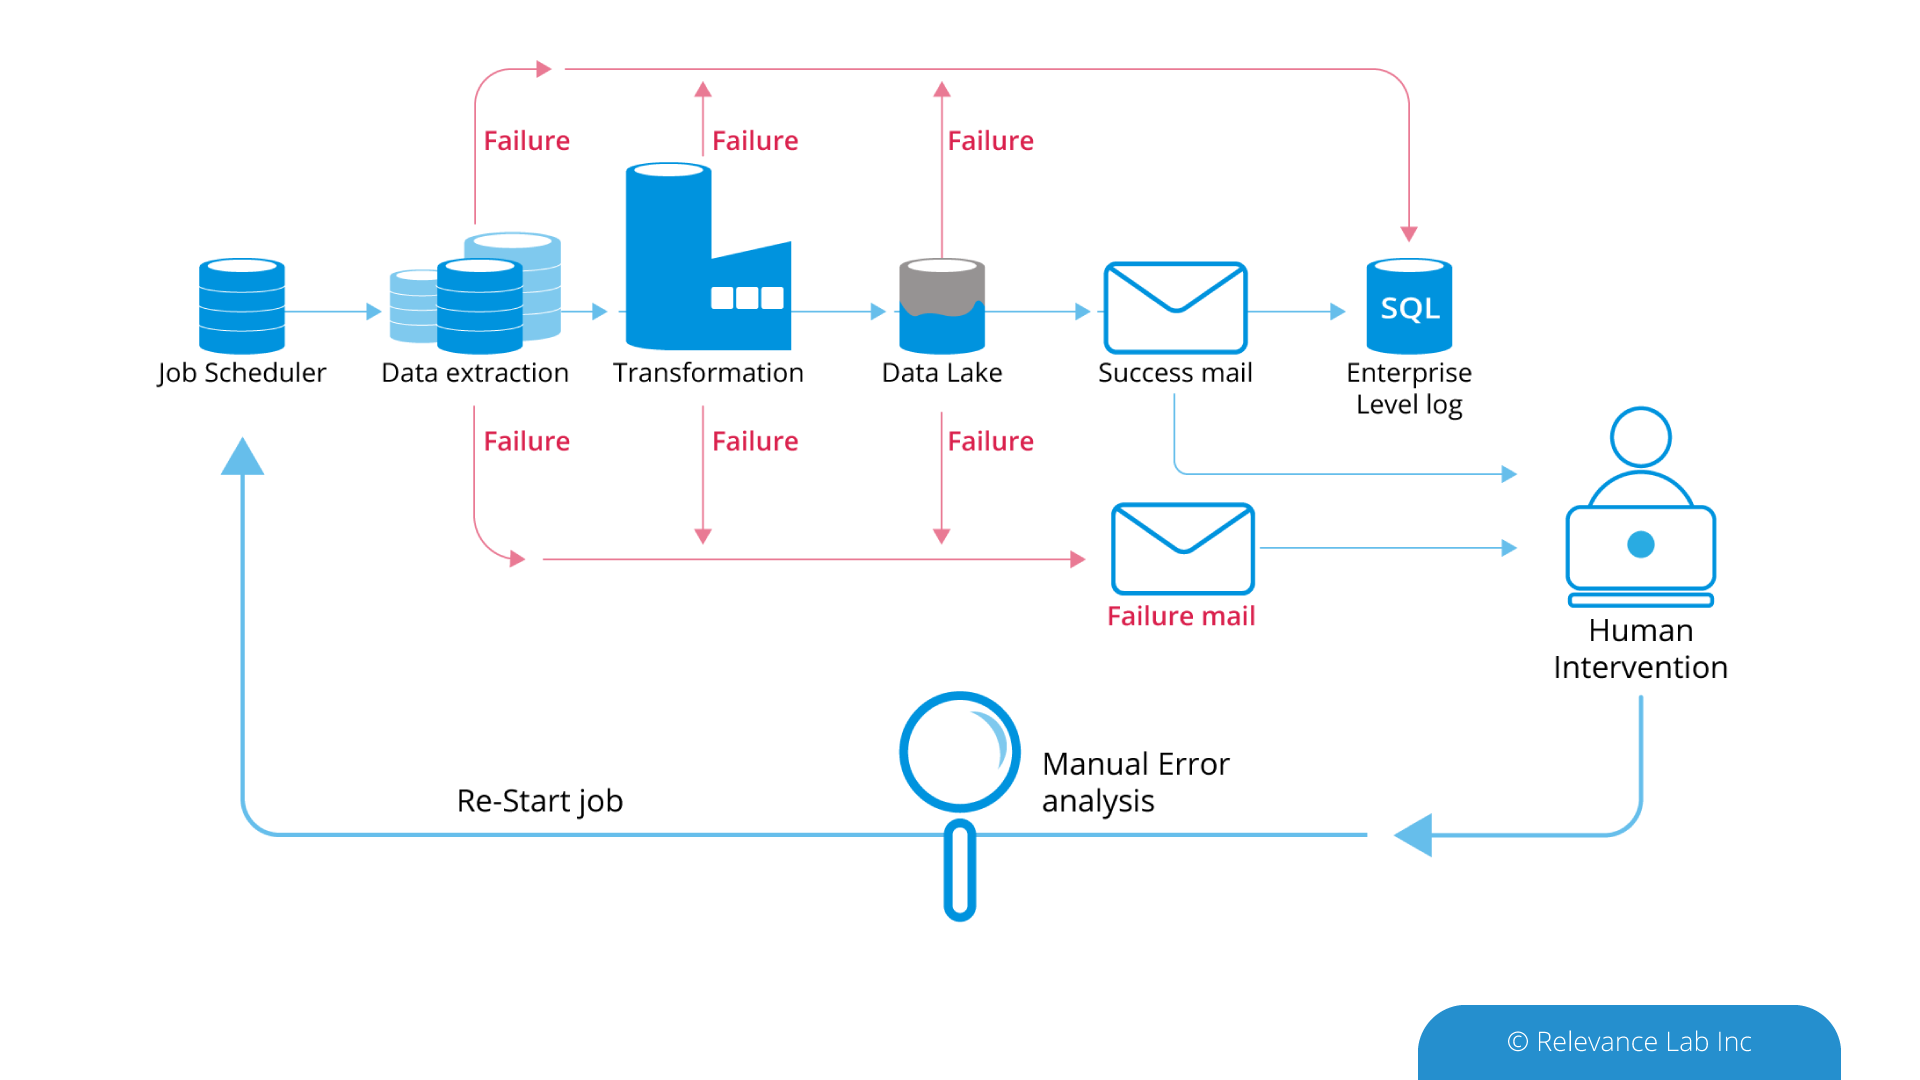
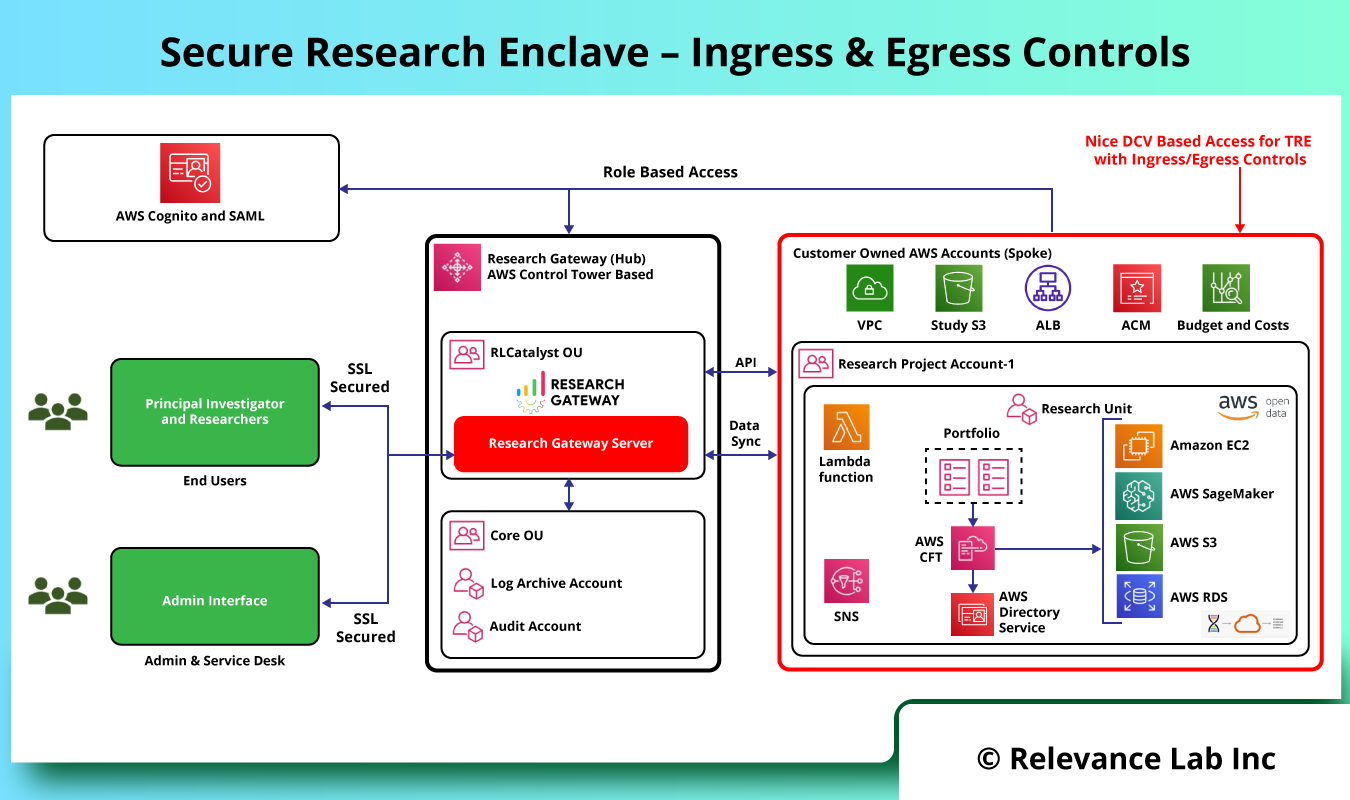
The Secure Research Environments Architecture provides for Secure Ingress and Egress controls as explained in the figure below.


Building Block Detailed Steps
Data Management
  • Project Administrator creates the Data Library and research projects.
  • Project Administrator selects the Data Library project.
    • Sets up Study Bucket.
    • Creates the sub-folders to hold data.
    • Sets up an Ingress bucket for each researcher to bring in his own data.
    • Shares this with the researcher.
  • Project Administrator selects the Study screen.
    • Creates an internal study for each dataset and assign to the corresponding Secure Research project.
    • Creates internal study for each ingress bucket.
  • Project Administrator assigns the researchers to the corresponding secure projects.
Secure Research Environments
  • Researcher logs in.
  • Research uploads own data to ingress bucket.
  • Researcher creates a workspace (secure research desktop).
  • Researcher connects to workspace.
  • Researcher runs code and generates output.
  • Researcher copies output to egress store.
  • Researcher submits and egress request from the portal.
Egress Application
  • Information Governance lead logs in to Egress portal.
  • IG Lead approves request.
  • Project administrator logs in to portal.
  • Project administrator approves the request.
  • IG Lead logs in and downloads the file.

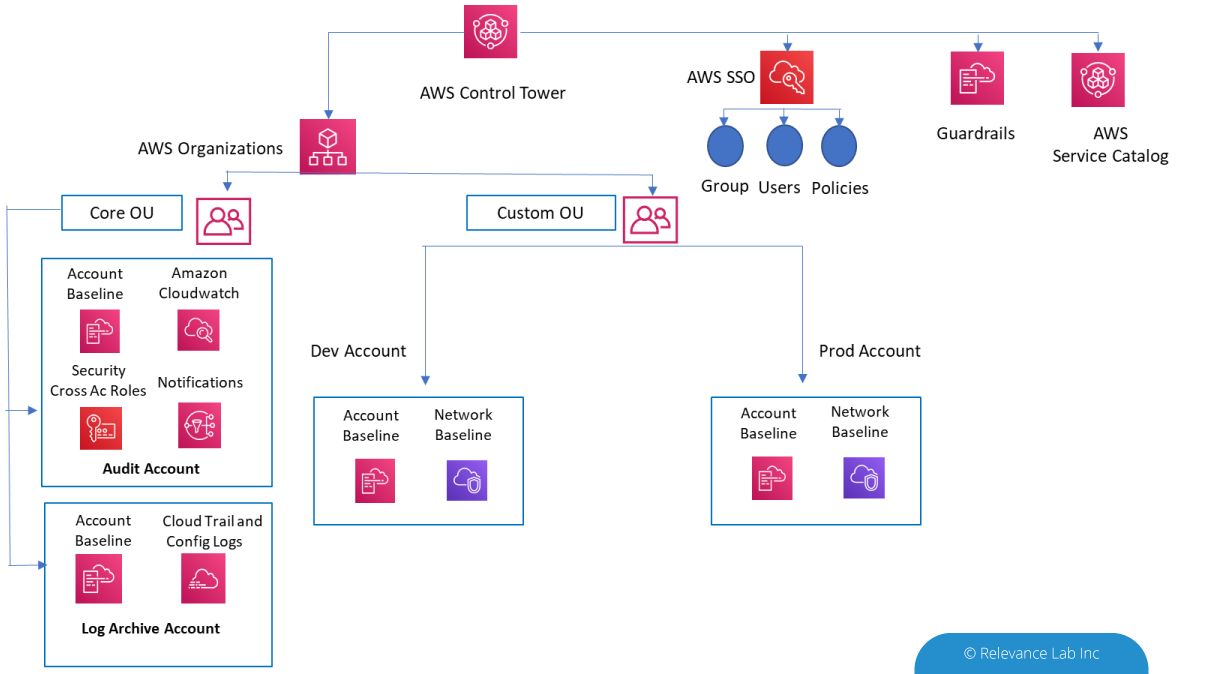
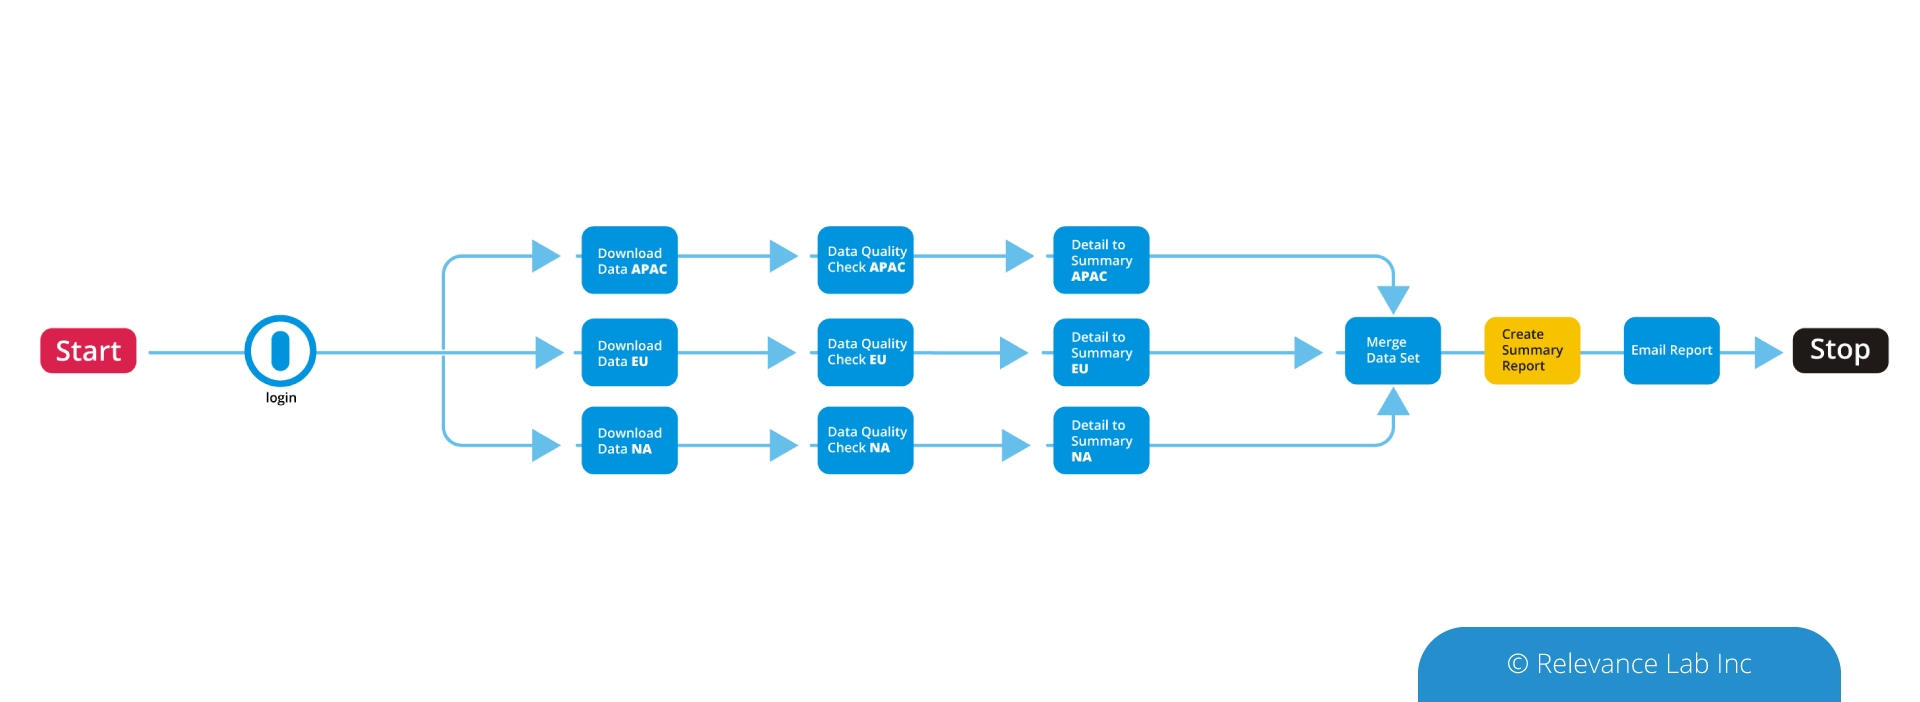
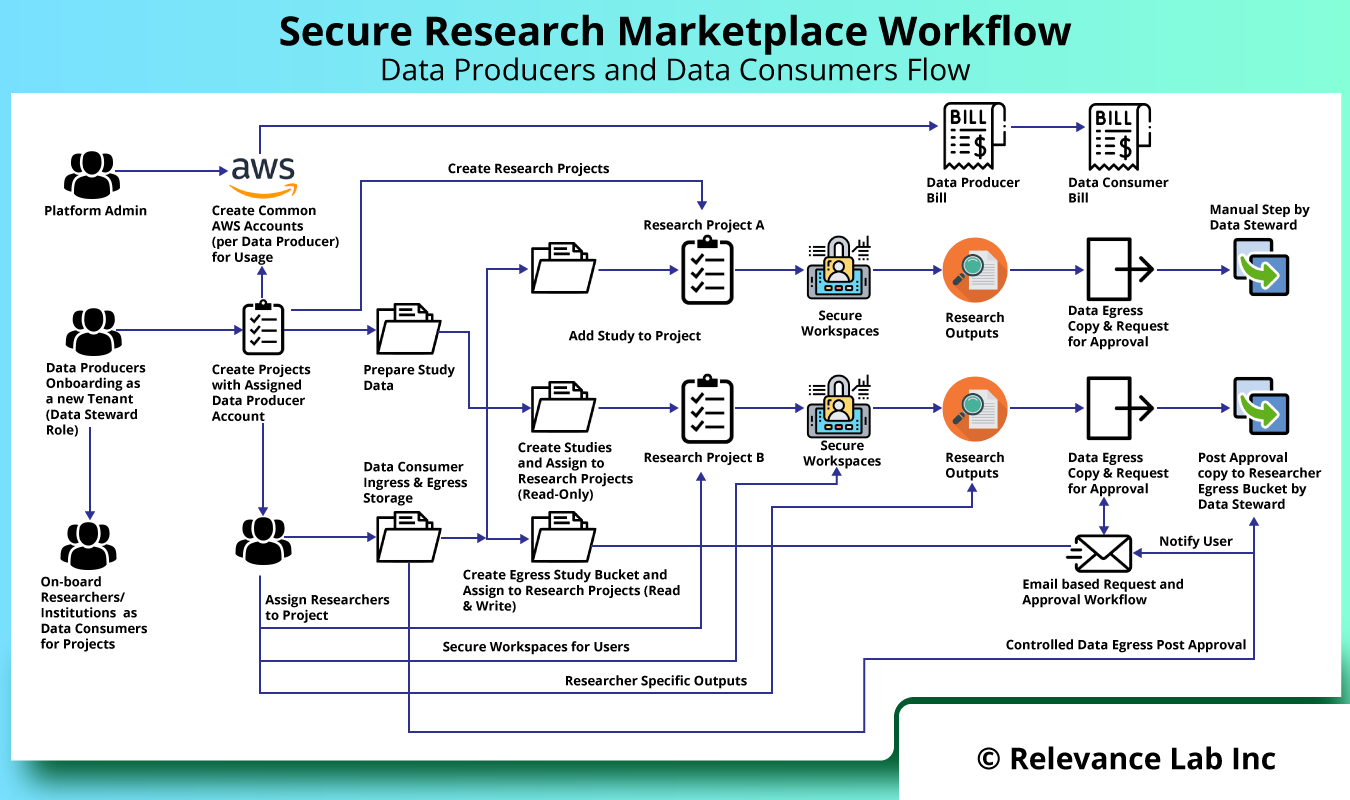
The need for Secure Research Enclave is a growing one across different countries. There is an emerging need for a consortium model, where multiple Data Producers and Consumers need to interact in a Secure Research Marketplace Model. The marketplace model is implemented on AWS Cloud and provides for tracking of costs and billing for all participants. The solution can be hosted by a third-party and provide Software as a Service (SaaS) model driving the key workflows for Data Producers and Data Consumers as explained in figure below.


Summary
Secure Research Environments are key features for enabling large institutions and governmental agencies to speed up research across different stakeholders leveraging the cloud. Relevance Lab provides a pre-built solution that can speed up the implementation of this large scale and complex deployment in a fast, secure, and cost-effective manner.

Here is a video demonstrating the solution.

To know more about this solution, feel free to write to marketing@relevancelab.com.

References
UK Health Data Research Alliance – Aligning approach to Trusted Research Environments
Trusted (and Productive) Research Environments for Safe Research
Deployment of Secure Data Environments on AWS
Microsoft Azure TRE Solution


0

2021 Blog, Blog, Command blog, Featured

AWS X-Ray is an application performance service that collects data about requests that your application processes, and provides tools to view, filter, and gain insights into that data to identify issues and opportunities for optimization. It enables a developer to create a service map that displays an application’s architecture. For any traced request to your application, you can see detailed information not only about the request and response, but also about calls that your application makes to downstream AWS resources, microservices, databases and HTTP web APIs. It is compatible with microservices and serverless based applications.

The X-Ray SDK provides

  • Interceptors to add to your code to trace incoming HTTP requests
  • Client handlers to instrument AWS SDK clients that your application uses to call other AWS services
  • An HTTP client to use to instrument calls to other internal and external HTTP web services

The SDK also supports instrumenting calls to SQL databases, automatic AWS SDK client instrumentation, and other features.

Instead of sending trace data directly to X-Ray, the SDK sends JSON segment documents to a daemon process listening for UDP traffic. The X-Ray daemon buffers segments in a queue and uploads them to X-Ray in batches. The daemon is available for Linux, Windows, and macOS, and is included on AWS Elastic Beanstalk and AWS Lambda platforms.

X-Ray uses trace data from the AWS resources that power your cloud applications to generate a detailed service graph. The service graph shows the client, your front-end service, and corresponding backend services to process requests and persist data. Use the service graph to identify bottlenecks, latency spikes, and other issues to solve to improve the performance of your applications.

AWS X-Ray Analytics helps you quickly and easily understand

  • Any latency degradation or increase in error or fault rates
  • The latency experienced by customers in the 50th, 90th, and 95th percentiles
  • The root cause of the issue at hand
  • End users who are impacted, and by how much
  • Comparisons of trends based on different criteria. For example, you could understand if new deployments caused a regression

How AWS X-Ray Works
AWS X-Ray receives data from services as segments. X-Ray groups the segments that have a Common request into traces. X-Ray processes the traces to generate a service map which provides a visual depiction of the application

AWS X-Ray features

  • Simple setup
  • End-to-end tracing
  • AWS Service and Database Integrations
  • Support for Multiple Languages
  • Request Sampling
  • Service map

Benefits of Using AWS X-Ray

Review Request Behaviour
AWS X-Ray traces customers’ requests and accumulates the information generated by the individual resources and services, which makes up your application, granting you an end-to-end view on the actions and performance of your application.

Discover Application Issues
Having AWS X-Ray, you could extract insights about your application performance and finding out root causes. As AWS X-Ray is having tracing features, you can easily follow request paths to diagnose where in your application and what is creating performance issues.

Improve Application Performance
AWS X-Ray’s service maps allow you to see connection between resources and services in your application in actual time. You could simply notice where high latencies are visualizing node, occurring and edge latency distribution for services, and after that, drilling down into the different services and paths having impact on the application performance.

Ready to use with AWS
AWS X-Ray operates with Amazon EC2 Container Service, Amazon EC2, AWS Elastic Beanstalk, and AWS Lambda. You could utilize AWS X-Ray with applications composed in Node.js, Java, and .NET, which are used on these services.

Designed for a Variety of Applications
AWS X-Ray operates for both simple and complicated applications, either in production or in development. With X-Ray, you can simply trace down the requests which are made to the applications that span various AWS Regions, AWS accounts, and Availability Zones.

Why AWS X-Ray?
Developers spend a lot of time searching through application logs, service logs, metrics, and traces to understand performance bottlenecks and to pinpoint their root causes. Correlating this information to identify its impact on end users comes with its own challenges of mining the data and performing analysis. This adds to the triaging time when using a distributed microservices architecture, where the call passes through several microservices. To address these challenges, AWS launched AWS X-Ray Analytics.

X-Ray helps you analyze and debug distributed applications, such as those built using a microservices architecture. Using X-Ray, you can understand how your application and its underlying services are performing to identify and troubleshoot the root causes of performance issues and errors. It helps you debug and triage distributed applications wherever those applications are running, whether the architecture is serverless, containers, Amazon EC2, on-premises, or a mixture of all of these.

Relevance Lab is a specialist AWS partner and can help Organizations in implementing the monitoring and observability framework including AWS X-ray to ease the application management and help identify bugs pertaining to complex distributed workflows.

For a demo of the same, please click here

For more details, please feel free to reach out to marketing@relevancelab.com


0

2020 Blog, Governance360, Blog, Command blog, Featured, RLAws Blogs

For Large Enterprise and SMBs with multiple AWS accounts, monitoring and managing multi-accounts is a huge challenge as these are managed across multiple teams running too few hundreds in some organizations.


AWS Control Tower helps Organizations set up, manage, monitor, and govern a secured multi-account using AWS best practices.


Benefits of AWS Control Tower

  • Automate the setup of multiple AWS environments in few clicks with AWS best practices
  • Enforce governance and compliance using guardrails
  • Centralized logging and policy management
  • Simplified workflows for standardized account provisioning
  • Perform Security Audits using Identity & Access Management
  • Ability to customize Control Tower landing zone even after initial deployment

Features of AWS Control Tower

a) AWS Control Tower automates the setup of a new landing zone which includes,


  • Creating a multi-account environment using AWS Organizations
  • Identity management using AWS Single Sign-On (SSO) default directory
  • Federated access to accounts using AWS SSO
  • Centralized logging from AWS CloudTrail, and AWS Config stored in Amazon S3
  • Enable cross-account security audits using AWS IAM and AWS SSO

b) Account Factory


  • This helps to automate the provisioning of new accounts in the organization.
  • A configurable account template that helps to standardize the provisioning of new accounts with pre-approved account configurations.

c) Guardrails


  • Pre-bundled governance rules for security, operations, and compliance which can be applied to Organization Units or a specific group of accounts.
  • Preventive Guardrails – Prevent policy violations through enforcement. Implemented using AWS CloudFormation and Service Control Policies
  • Detective Guardrails – Detect policy violations and alert in the dashboard using AWS Config rules

d) 3 types of Guidance (Applied on Guardrails)


  • Mandatory Guardrails – Always Enforced. Enabled by default on landing zone creation.
  • Strongly recommended Guardrails – Enforce best practices for well-architected, multi-account environments. Not enabled by default on landing zone creation.
  • Elective guardrails – To track actions that are restricted. Not enabled by default on landing zone creation.

e) Dashboard


  • Gives complete visibility of the AWS Environment
  • Can view the number of OUs (Organization Units) and accounts provisioned
  • Guardrails enabled
  • Check the list of non-compliant resources based on guardrails enabled.

e) Customizations for Control Tower


  • Gives complete visibility of the AWS Environment
  • Trigger workflow during an AWS Control Tower Lifecycle event such as adding a new managed account
  • Trigger customizations to AWS Control Tower using user provided configuration changes

Steps to setup AWS CT


Setting up a Control Tower on a new account is relatively simpler when compared to setting it up on an existing account. Once Control Tower is set up, the landing zone should have the following.


  • 2 Organizational Units
  • 3 accounts, a master account and isolated accounts for log archive and security audit
  • 20 preventive guardrails to enforce policies
  • 2 detective guardrails to detect config violations

Steps to customize AWS CT
Customizations to a Control Tower can be done using an AWS CloudFormation template at OU and Account levels and service control policies (SCPs) at the OU level. The setup for enabling CT customizations is provided within an AWS CloudFormation template which creates AWS CodePipeline, AWS CodeBuild projects, AWS Step Functions, AWS Lambda functions, an Amazon EventBridge Event rule, an AWS SQS queue, an Amazon S3 or AWS CodeCommit repository to hold the custom resource package file.
Once the setup is done, customizations to AWS CT can be done as follows

  • 2 Organizational Units
  • Upload a custom package file to Amazon S3 or AWS CodeCommit repository
  • The above action triggers the AWS CodePipeline workflow and corresponding CI/CD pipeline for SCPs and CloudFormation StackSets to implement the customizations
  • Alternately when a new account is added, a Control Tower Lifecycle event triggers the AWS CodePipeline workflow via the Amazon EventBridge, AWS SQS and AWS Lambda


The next step is to create a new Organizational unit and then create a new account using the account factory and map it to the OU that was created. Once this is done, you can start setting up your resources and any non-compliance starts reflecting in the Noncompliant resources’ dashboard. In addition to this, any deviation to the standard AWS best practices would be reflected in the dashboard.


Conclusion
With many of the organizations opting for and using AWS cloud services, AWS Control Tower with the centralized management service and ability to customize the initially deployed configurations, offers the simplest way to set up and govern multiple AWS accounts on an ongoing basis securely through beneficial features and established best practices. Provisioning new AWS accounts are as simple as clicking a few buttons while agreeing to the organization’s requirements and policies. Relevance Lab can help your organization to build AWS Control Tower and migrate your existing accounts to Control Tower.

For a demo of Control Tower usage in your organization click here

For more details, please feel free to reach out to marketing@relevancelab.com


0

2020 Blog, Analytics, Blog, Command blog, Featured

Automation with simple scripts is relatively easy, but complexity creeps in to solve real-world production-grade solutions. A compelling use case was shared with us by our large Financial Asset management customer. They deal with this customer who provides a large number of properties & financial data feeds with multiple data formats coming in different frequencies ranging from daily, weekly, monthly and ad-hoc. The customer business model is driven based on Data processing on these feeds and creating “data-pipelines” for ingestion, cleansing, aggregation, analysis, and decisions from their Enterprise Data Lake.


The current ecosystem of customer comprises multiple ETL Jobs, which connects to various internal, external systems and converts into a Data Lake for further data processing. The complexity was enormous as the volume of data was high and lead to high chances of failures and indeed required continuous human interventions and monitoring of these jobs. Support teams receive a notification through emails when a job is only completed successfully or on failure. Thus, the legacy system makes job monitoring and exception handling quite tricky. The following simple pictorial representation explains a typical daily Data Pipeline and associated challenges:


The legacy solution has multiple custom scripts implemented in Shell, Python, Powershell that would make a call to Azure Data Factory via an API call to run a pipeline. Each independent task had its complexities, and there was a lack of an end to end view with real-time monitoring and error diagnostics.


A new workflow model was developed using the RLCatalyst workflow monitoring component, (using YAML definitions) and the existing customer scripts were converted to RLCatalyst BOTs using a simple migration designer. Once loaded into RLCatalyst Command Centre, the solution provides a real-time and historical view with notifications to support teams for anomaly situations and ability to take auto-remediation steps based on configured rules.


We deployed the entire solution in just three weeks in the customer’s Azure environment along with migrating the existing scripts.


RLCatalyst Workflow Monitoring provides a simple and effective solution much different from the standard RPA tools. RPA deals with more End-User Processing workflows while RLCatalyst Workflow Monitoring is more relevant for Machine Data Processing Workflows and Jobs.


For more information feel free to contact marketing@relevancelab.com


0