2022 Blogs, Analytics, SPECTRA Blog, Blog, Featured
Boosting customer retention with Machine Learning
If you are a business with a digital product or a subscription model, then you are already familiar with this key metric – “Customer Churn”.
Customer Churn is the percentage of customers who stopped using your product during a given period. This is a critical metric, as it not only reflects customer satisfaction but it also has a big impact on your bottom line. A common rule of the thumb is that it costs 6-7 times to get a new customer versus keeping the customers you already have. In addition, existing customers are expected to spend more over time, and satisfied customers lead to additional sales through referrals. Market studies show that increasing customer retention by small percentage can boost revenues significantly. Further research reveals that most professionals consider that Churn is just as or more important a metric than new customer acquisitions.
Subscription businesses strongly believe customers cancel for reasons that could be managed or fixed. “Customer Retention” is the set of strategies and actions that a company follows to keep existing customers from churning. Employing a data-driven customer retention strategy, and leveraging the power of big data and machine learning, offer significant opportunities for businesses to create a competitive advantage versus their peers that don’t.
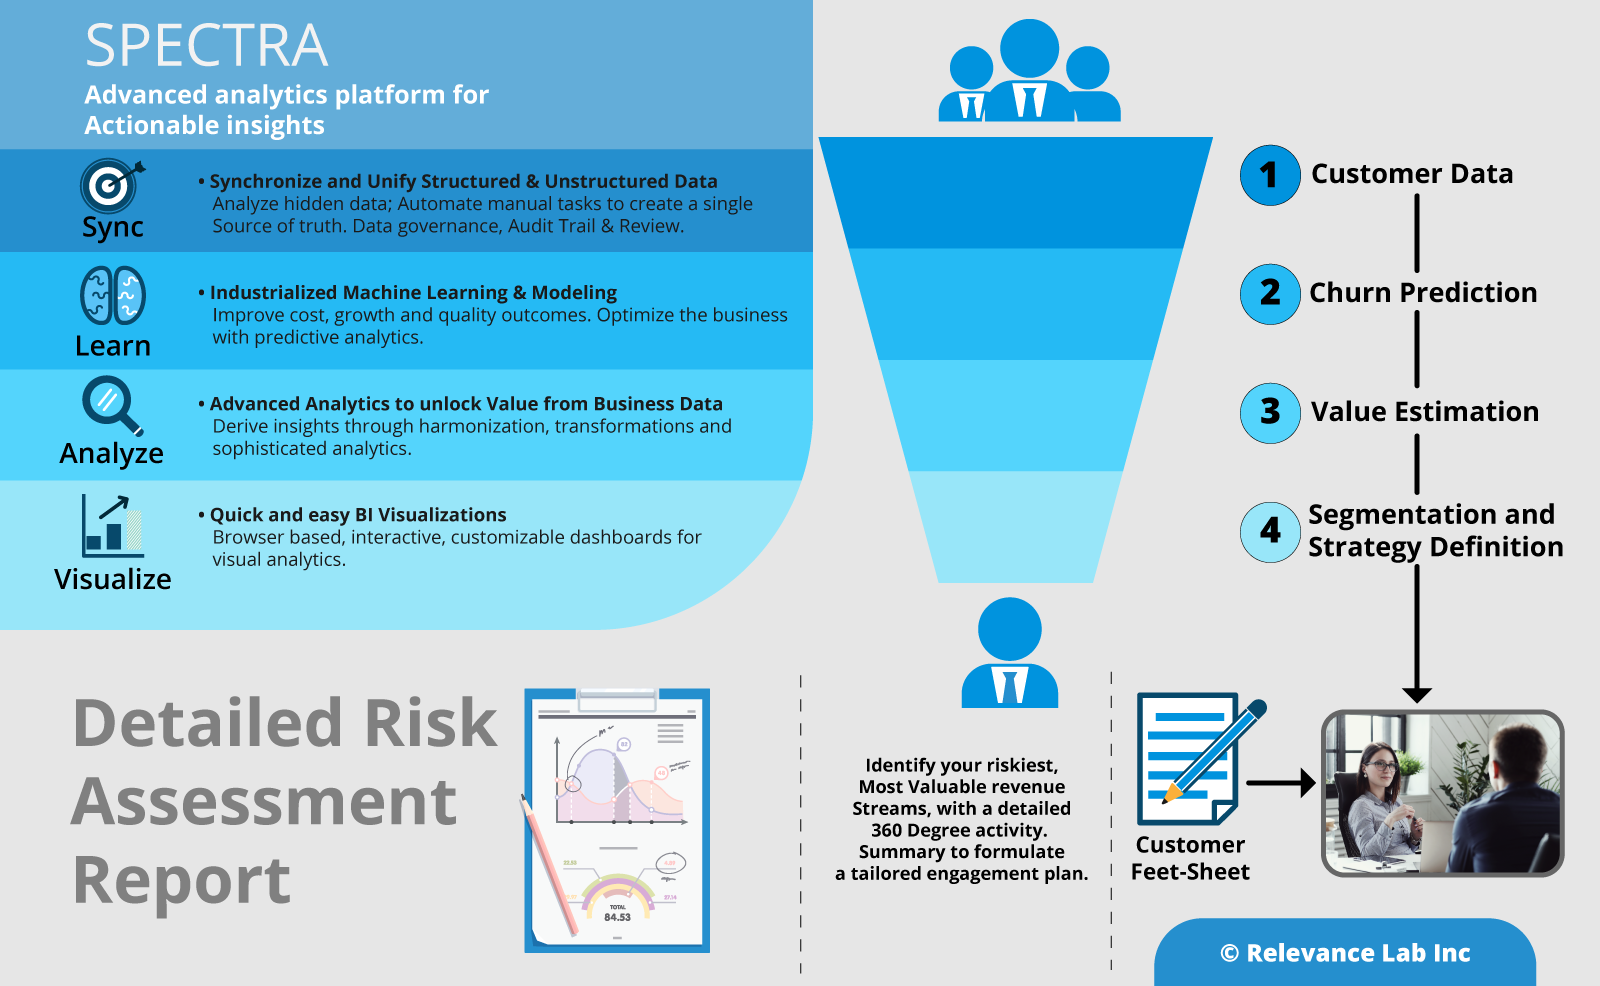
Relevance Lab (RL) recently helped a large US based Digital learning company benefit from a detailed churn analysis of its subscription customers, by leveraging the RL SPECTRA platform with machine learning. The portfolio included several digital subscription products used in school educational curriculums which are renewed annually during the start of the school calendar year. Each year, there were several customers that did not renew their licenses and importantly, this happened at the end of the subscription cycle; typically too late for the sales team to respond effectively.
Here are the steps that the organisation took along the churn management journey.
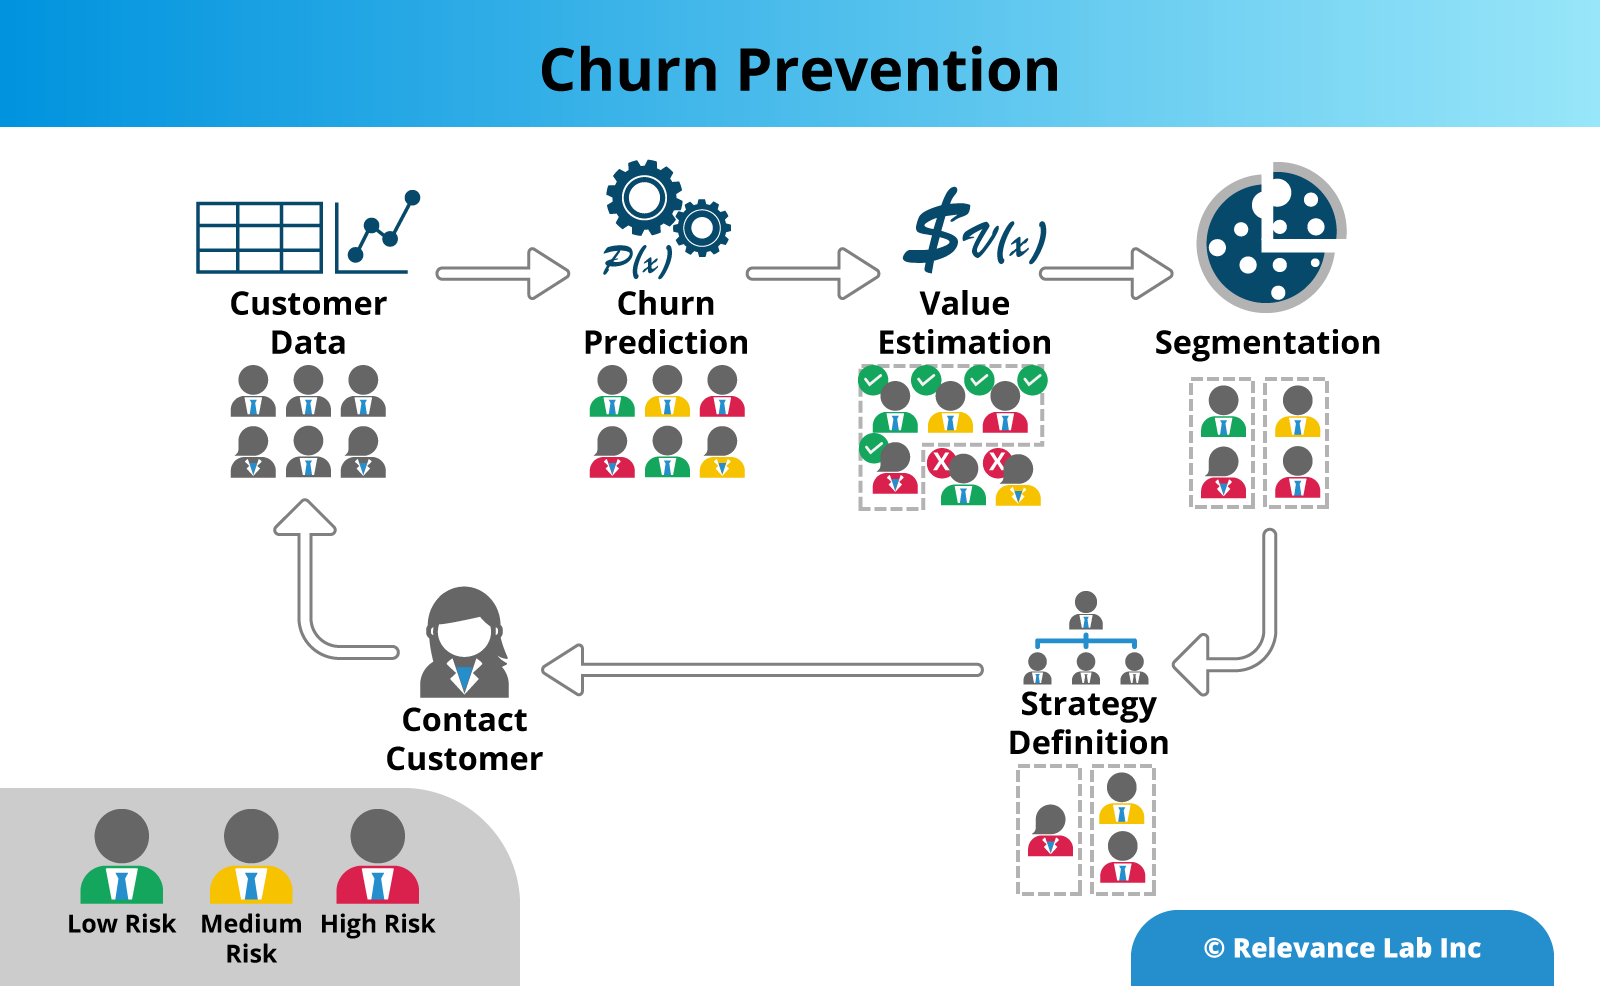
- Gather multiple data points to generate better insights
As with any analysis, to figure out where your churn is coming from, you need to keep track of the right data. Especially with machine learning initiatives, the algorithms depend on large quantities of raw data to learn complex patterns. A sample list of data attributes could include online interactions with the product, clicks, page views, test scores, incident reports, payment information, etc, it could also include unstructured data elements such as reports, reviews and blog posts.
In this particular example, the data was pulled from four different databases which contained the product platform data for our relevant geography. Data collected included product features, sales and renewal numbers, as well as student product usage, test performance statistics etc, going back to the past 4 years.
Next, the data was cleansed to remove trial licenses, dummy tests etc, and to normalize missing data. Finally, the data was harmonized to bring all the information into a consolidated format.
All the above pipelines were established using the SPECTRA ETL process. Now there was a fully functional data setup with cleaned data ordered in tables, to be used in the machine learning algorithms for churn prediction. - Predictive analytics use Machine Learning to know who is at risk
Once you have the data, you are now ready to work on the core of your analysis, to understand where the risk of churn is coming from, and hence identify the opportunities for strengthening your customer relationships. Machine learning techniques are especially suited to this task, as they can churn massive amounts of historical data to learn about customer behavior, and then use this training to make predictions about important outcomes such as retention.
On our assignment, the RL team tried out a number of machine learning models built-in within SPECTRA to predict the churn and zeroed in on a random forest model. This method is very effective when using inconsistent data sets, where the system can handle differences in behavior very effectively by creating a large number of random trees. In the end, the system provided a predicted rating for each customer to drop out of the system and highlighted the ones most at risk. - Define the most valuable customers
Parallel to identifying customers at risk of churn, data can also be used to segment customers into different groups to identify how each group interacts with your product. In addition, data regarding frequency of purchase, purchase value, product coverage helps you to quickly identify which type of customers are driving the most revenue, versus customers which are a poor fit for your product. This will then allow you to adopt different communication and servicing strategies for each group, and to retain your most valuable customers.
By combining our machine learning model output with the segmentation exercise, the result was a dynamic dashboard, which could be sorted/filtered by different criteria such as customer size and geographical location. This provided the opportunity to highlight the customers which were at the highest risk, from the joint viewpoint of attrition and revenue loss. This in turn enabled the client to effectively utilize sales team resources in the best possible manner. - Engage with the customers
Now that you have identified your top customers who you are at risk of losing, the next step is to actively engage with them, to incentivise the customers to stay with you, by being able to help the customer achieve real value out of your product.
The nature of engagement could depend on the stage the customer is in the relationship. Is the customer in the early stage of product adoption? This could then point to the fact that the customer is unable to get set up with your product. Here, you have to make sure that the customer has access to enough training material, maybe the customer requires additional onboarding support.
If the customer is in the middle stage, it could be that the customer is not realizing enough business value out of your product. Here, you need to check in with your customer, to see whether they are making enough progress towards their goals. If the customer is in late stage, it is possible that they are looking at competitor offerings, or they were frustrated with bugs, and hence the discussion would need to be shaped accordingly.
To tailor the nature of your conversation, you need to take a close look at the customer product interaction metrics. In our example, all the customer usage patterns, test performance, books read, word literacy, etc, were collected and presented as a dashboard, as a single point of reference for the sales and marketing team to easily review customer engagement levels, to be able to connect constructively with the customer management.
Conclusion
If you are looking at reducing your customer churn and improving customer retention, it all comes down to predicting customers at risk of churn, analyzing the reasons behind churn, and then taking appropriate action. Machine learning based models are of particular help here, as they can take into account hundreds and even thousands of different factors, which may not be obvious or even possible to track for a human analyst. In this example, the SPECTRA platform helped the client sales team to predict the customers’ inclination for renewal of the specific learning product with 92% accuracy.
Additional references
Research from Bain and Co. shows that increasing customer retention by even 5% boosts revenues by 25% – 95%
Reportfrom Brightback reveals Churn is just as or more important a metric than new customer acquisitions
To learn how you can leverage machine learning and AI within your customer retention strategy, please reach out to marketing@relevancelab.com